As medical students, we often encounter concepts like dose-response relationships in pharmacology. These relationships are foundational for understanding drug behavior, safety, and clinical utility. Let’s break down the key principles of Dose-Response Curves (DRC) and Log Dose-Response Curves (Log DRC)—and why they matter in practice.
Dose-Response Curve (DRC): The Hyperbola
The classic DRC is a hyperbola-shaped graph that plots the dose of a drug (X-axis) against its effect (Y-axis). While mathematically straightforward, this curve has limitations:
- Non-linear scaling: Small dose changes at low doses cause large effects, while high doses show minimal added effect.
- Less clinically useful: The hyperbola makes it hard to compare drugs or interpret critical parameters like potency and efficacy.
Log Dose-Response Curve (Log DRC): The Sigmoid Curve
Replacing the dose axis with a logarithmic scale transforms the hyperbola into an S-shaped (sigmoid) curve. This simple change offers major clinical advantages:
 |
| Fig. 1 |
1. Linear mid-portion: Simplifies comparison of drug parameters.
2. Identifies key metrics: Potency, efficacy, and slope can be directly measured (Fig ).
Key Parameters from Log DRC
 |
| Fig. 2 |
1. Potency
- Definition: The dose required to produce a specific effect.
- Clinical Insight: A drug requiring a lower dose to achieve the same effect is more potent (e.g., Drug D vs. B in Fig ).
- Mythbuster: Potency ≠ superiority. A potent drug isn’t necessarily better—it just needs a smaller dose.
2. Efficacy
- Definition: The maximum effect a drug can produce, regardless of dose.
- Clinical Insight: Efficacy is king! A highly efficacious drug (e.g., Drug C in Fig 2) is prioritized over a potent one if the goal is strong therapeutic effect (e.g., pain relief).
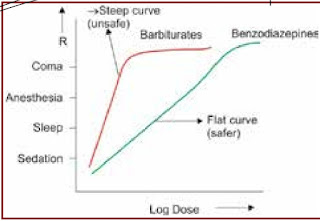
3. Slope
- Definition: Steepness of the curve’s mid-portion.
- Clinical Insight:
- Steep slope: Small dose changes cause large effects → Narrow safety margin (e.g., barbiturates).
- Flat slope: Safer, wider therapeutic window (e.g., benzodiazepines for insomnia).
Selectivity: Avoiding Off-Target Effects
A drug with multiple actions shows separate Log DRCs for each effect.
- Selective drugs: Curves are far apart on the X-axis (e.g., Drug A selectively dilates bronchi without significant cardiac effects).
- Non-selective drugs: Overlapping curves → Higher risk of side effects (e.g., Drug B affects both lungs and heart).
Quantal DRC: All-or-None Effects
For population responses (e.g., seizure prevention), Quantal DRCs plot the percentage of subjects responding (Y-axis) against dose (X-axis). Key metrics:
- ED₅₀: Dose effective in 50% of subjects.
- LD₅₀: Dose lethal in 50% of subjects.
- Therapeutic Index (TI): TI = LD₅₀/ED₅₀.
- High TI (e.g., penicillin) = Safe.
- Low TI (e.g., digoxin) = Requires careful monitoring.
Clinical Pearls
1. Efficacy > Potency: Choose drugs based on maximum effect, not dose size.
2. Slope = Safety: Flatter curves (e.g., benzodiazepines) reduce overdose risk.
3. TI matters: Always check a drug’s TI—especially for narrow-therapeutic-index drugs (e.g., warfarin).
Graphs in Action
- Fig 1: Sigmoid Log DRC highlighting ED₅₀, slope, and efficacy.
- Fig 2: Drug comparisons: Left-shifted = potent; Higher curve = efficacious.
Final Takeaway
Mastering DRCs and Log DRCs empowers you to predict drug behavior, compare therapies, and optimize patient safety. Remember: A drug’s efficacy and safety (not just potency) define its clinical value!
“In pharmacology, curves speak louder than words!”
Visual aids and practice questions on DRCs are highly recommended to solidify these concepts. Happy studying!📚💊
Thank you.


.jpeg)
.jpeg)


.jpeg)
.jpeg)

0 Comments